Specialist in Asia Pacific, Japan, China, India and South East Asia and Global Emerging Market equities.
Discover moreformerly Realindex Investments
Leader in active quantitative equities across Australian equities, global equities, emerging markets and global small companies.
Backed by a unique blend of research, portfolio construction and risk management, focused on uncovering original insights and translating them into investment strategies that are active and systematic, aiming to generate alpha.
Discover moreInvestment strategies
Insights
At Stewart Investors, we believe in putting people first. Our investment world-view is of a series of partnerships – with each other, with our clients, with the companies we invest in, the people who buy their goods and services, and with the wider society in which we all live and work.
Discover more
It’s no secret that fixed income markets have experienced a tough couple of years. Significant increases in cash rates and inflation expectations over this period have pushed bond yields higher and, in turn, prices lower. In many cases, bond yields are now trading close to their highest levels in more than 12 years. In this article, we focus on the key drivers we are watching to judge when this “Big Reset” might be complete.
Markets worldwide spent much of 2008-2021 adjusting to unprecedented central bank support. This period began with policymakers’ response to the Global Financial Crisis (GFC) and finished at the end of the COVID pandemic. Much of this period saw cash rates in key regions at, or below, zero. Central bank balance sheets became bloated mostly with government bonds as authorities bought assets to support financial markets.
Figure 1: Developed market overnight rates
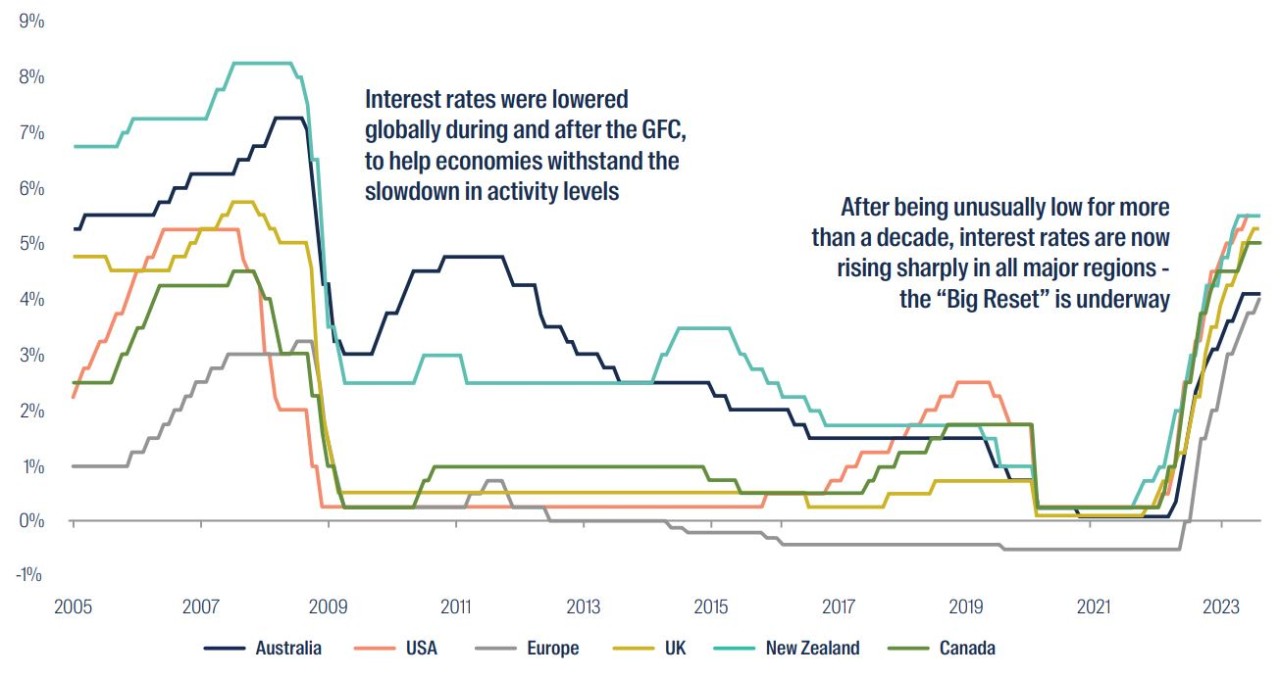
Source: Bloomberg. Data shown 1 January 2005 to 30 September 2023
In 2021, two major changes marked an inflection point for the “Big Reset” to begin.
1. Inflation exploded globally
- COVID lockdowns significantly disrupted manufacturing and supply chains across the globe, increasing both product prices and delivery costs. Commodity prices also began to skyrocket as the conflict in Ukraine unfolded.
- The scale of the global pandemic support delivered by governments and central banks was unprecedented and, in hindsight, arguably excessive. Consumers looked to deploy excess savings once the pandemic eased, resulting in an increase in global demand.
- These factors have seen inflation soar and the Consumer Price Index is now meaningfully above central bank targets in all key regions. Policymakers have responded by raising cash rates, hoping to dampen discretionary spending and bring inflation under control.
2. The “elephants” have left the room
- With the global economy in full recovery and cash rates moving higher, central banks began to unwind their balance sheets, selling securities they had acquired in the preceding years. Central banks, previously the largest buyers of government bonds, became sellers.
- Government finances around the world were required to fund huge deficits from higher spending during the COVID pandemic. Markets have been flooded with higher bond issuance as governments look to repair their financial positions.
Historically, transitions away from aggressive central bank policies created volatility in financial markets, owing to uncertainty around the pivot from one interest rate regime to another. We believe that a soft landing is the most likely outcome over the next six to nine months whereby policymakers are able to engineer a slowdown in economic growth and inflation, without tipping economies into recession, and further changes in central bank policy will be gradual following a recent pause in the tightening cycle.
Where to from here? We share our thoughts on inflation, the pending actions of central banks regarding cash rates and, in turn, the possible implications for long-term bond yields.
Inflation
With some of the very large increases in prices in late 2022 and early 2023 rolling off the calculations, referred to as the ‘base effect’, we believe annual inflation will continue to moderate well into 2024. The most recent data, including 3-month and 6-month annualised run rates, are converging back towards central bank target rates. In some cases, most notably in the United States (US), readings such as the Multivariate Core Trend1 and the Underlying Inflation Gauge2 have nearly recovered to pre-COVID levels.
We are mindful of stickier elements of inflation, which might be harder to dislodge from the official data. These include rent or shelter costs and the prices of other services that have lagged the rise in goods prices globally, and which may remain elevated due to surprisingly robust economic growth rates, low unemployment levels, and strong wage growth. Central banks are not forecasting a return to target inflation rates until 2025 or 2026, suggesting they could continue to warn about the possibility of further interest rate hikes, and guide investors away from the possibility of premature policy easing.
Figure 2: US Inflation
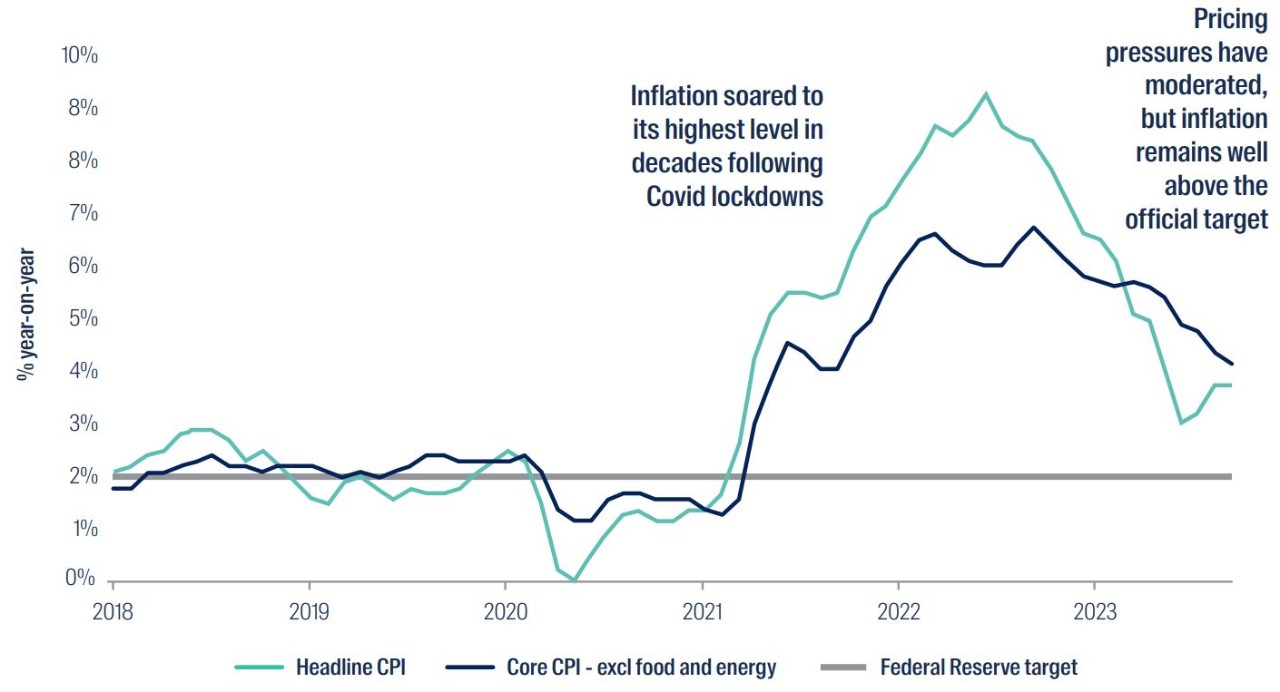
Source: Bloomberg. Data shown 1 January 2018 to 30 September 2023
Cash rates
Following the sharp rises over the past 18-24 months, overnight cash rates in many parts of the world are at or near their cycle highs, in our view. Most major central banks now regard the risks to economies as more balanced, and given our inflation view, we believe policymakers’ ‘higher for longer’ stance will be maintained. Some countries might be required to raise cash rates by another 0.25-0.50% in the next 12 months if delays in inflation returning to target exhaust central banks’ patience. At the very least, we feel policymakers will likely seek to guide markets forcefully away from expecting rate cuts until inflation is much closer to target levels or growth begins to falter.
Although this is our base case, our inflation and interest rate views are fluid. We are mindful of a potential re-acceleration of the global economy by mid-2024 driven by US economic strength, which in turn could require another round of rate hikes to counter this.
Long-term bond yields
Yields on longer-dated fixed income securities consist of two elements: expectations regarding the future path of cash rates and the term premium. Term premium, defined as the compensation that investors demand for interest rate risk in bonds, plays a critical role in understanding yield movements. The impacts from central banks unwinding their balance sheets, increased government bond issuance, geopolitical events and uncertainty around future inflation all suggest we could see further upward pressure on long-term yields i.e. the term premium and yield curve moving higher. The grey line in Figure 3 shows how much of an effect the recent increase in term premium has had on bond yields, over and above the market’s expectations of higher interest rates.
Figure 3: US 10-year term premium
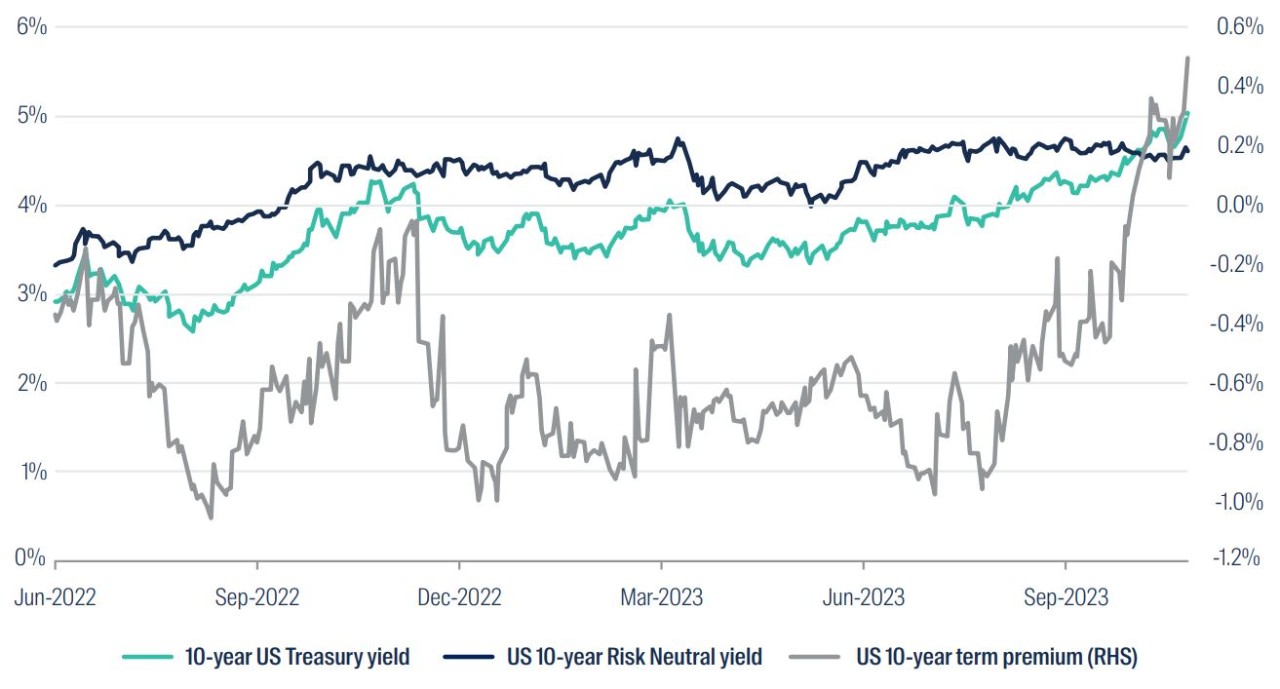
Source: Bloomberg. Data shown 1 June 2022 to 19 October 2023
What signs are we looking for to suggest the “Big Reset” could be complete?
- First, we expect the Bank of Japan to strongly support and defend its recently announced 1.00% target for 10-year Japanese Government Bond (JGB) yields. The Bank of Japan changed its Yield Curve Control policy in July, doubling the cap on 10-year yields from 0.50% to 1.00%. This is a strong and underappreciated driver of global rates, given the Japanese yen has long been regarded as a funding currency, and since JGBs have anchored global rates. Japanese bonds have not participated in the global sell-off to the same extent as other sovereign bond markets due to stable Japanese monetary policy, which has seen official cash rates remain unchanged in Japan for more than seven years. While this yield adjustment is ongoing, we believe upward pressure on global yields could persist.
- Base effects continuing to slow inflation to a pace that may be slightly higher than central bank forecasts, but without any big upside (greater than +0.50% from target) surprises.
- Asset selection starts to favour US Treasury yields over equity earnings yields by greater than 0.50%. Currently, 2-year US Treasury yields are close to 5.20%3, compared to an earnings yield of around 4.75%4 on the S&P 500 Index.
- With the Effective Federal Funds rate5 currently above 5.30%, we are looking for yields on 10-year Treasuries to approach that level and largely remove the negative carry still embedded in yields before we consider the market to have reached a more stable equilibrium.
- The risk/reward balance favours our forecast for a further increase in term premium and the possibility of further increases in cash rates.
If bond markets travel as expected and the “Big Reset” is close to completion, fixed income should appeal to investors. Specifically, an allocation to bonds currently offers a good opportunity to access attractive, credit risk-free income streams.
For local investors, for example, a 0.50% increase in the 10-year Australian Commonwealth Government Bond yield from today’s 4.73% would still generate a total return of 0.9% over a one-year holding period. Conversely, the yield falling 0.50% would result in an 8.6% return.
The skew is now much more in favour of investors than it was during the extended period of near-zero interest rates following the GFC, because higher rates mean higher income streams, cushioning any potential capital depreciation of bonds. In order to have a negative return over a one-year holding period, 10-year Australian Commonwealth Government Bond yields would need to rise 0.60%, on top of the 3.70% they have already risen over the past two years or so as the Reserve Bank of Australia has increased the official cash rate from 0.10% to the current 4.10%. Regardless of the future interest rate path and the potential for some variability in returns along the way, long-term investors will capture an annualised, risk-free return of nearly 5% over ten years if purchased bonds are held to maturity.
As a reminder, fixed income offers two main attributes to investors:
- Income – Low-risk 10-year government bonds in the US, Australia and New Zealand are typically offering yields between 4.50% and 5.50%. Highly rated corporate bonds are providing even more appealing income streams, typically between 5.75% and 6.50%. These are the most enticing levels for more than a decade. First Sentier Investors’ flagship Australian Fixed Income Fund, which consists primarily of State and Government bonds, is currently yielding around 5.20%6.
Figure 4: Prospective yields from US Treasuries and Investment Grade Corporate Bonds
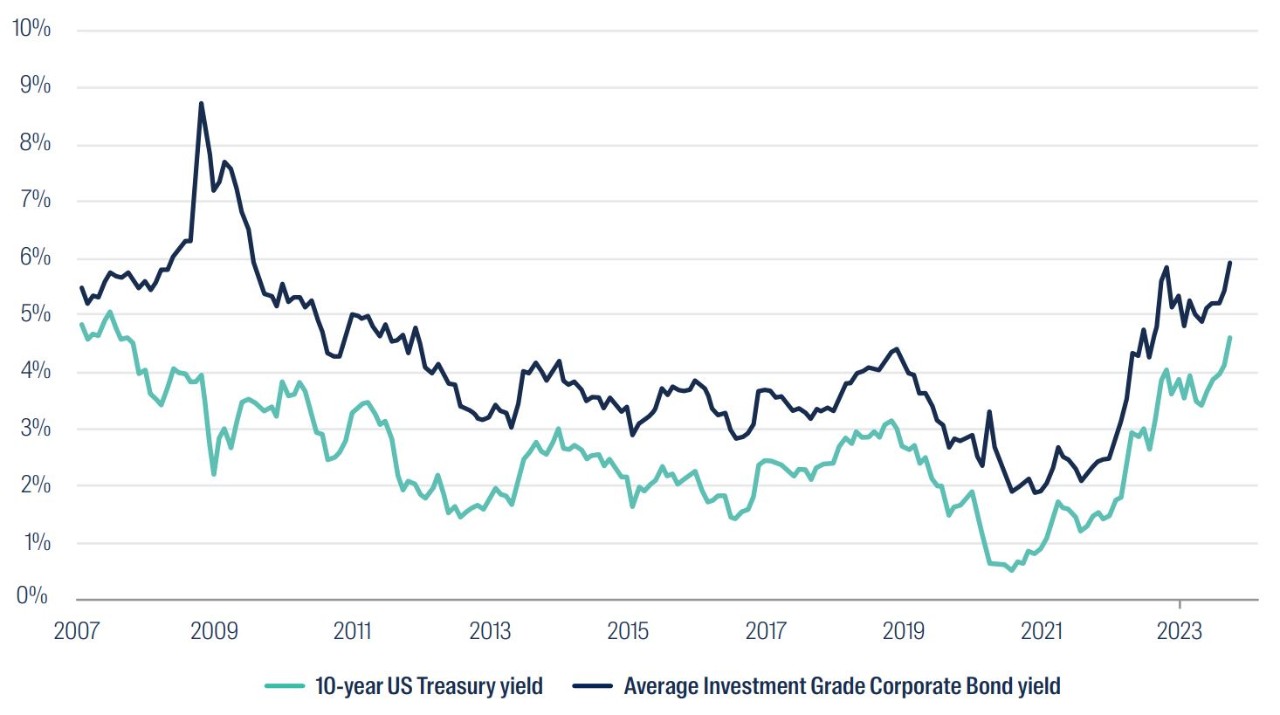
Source: Bloomberg. Data shown 1 January 2007 to 30 September 2023. Investment Grade Corporate Bonds are represented by the Bloomberg Global Aggregate Corporate Index.
- Diversifier to equities – Post the cyclical “Big Reset” that appears to be nearly complete, we believe the correlation between fixed income and equities will reassert itself. We saw this during the banking crisis of March 2023, when bond prices increased (as yields fell by around 0.50%) and the S&P 500 Index fell around 5% during that two-week period. An allocation to fixed income should therefore provide useful diversification from risk assets, helping investors generate smoother, more stable overall returns from their investment portfolios over time. Of course, credit spreads compensate investors for more than default risk; liquidity and volatility are other notable factors. But in broad terms, considering volatility remains subdued and liquidity risks are not heightened, the current level of spreads indicates that investors expect defaults in both the investment grade and high yield sectors to be close to – or slightly below – long-term averages in the period ahead.
With these considerations in mind, we consider the current risk/ reward trade-off for holding bonds to be particularly favourable and could present investors with a good opportunity to increase exposure to fixed income assets.
The Australian Fixed Income team at First Sentier Investors is among Australia’s largest and most established fixed income managers, with a track record extending back more than 25 years. We are able to source a variety of investment opportunities both within Australia and overseas, utilising the insights of specialist resources in the world’s largest bond markets. Our team seeks to deliver long-term excess returns, but has an over-arching emphasis on capital preservation.
1 A model that measures inflation’s persistence across the core sectors of personal consumption expenditures (PCE) price index.
2 This captures sustained movements in inflation from information contained in a broad set of price, real activity, and financial data.
3 Source: Bloomberg. Data as at 19 October 2023.
4 Source: Bloomberg. Data as at 19 October 2023.
5 A daily effective interest rate, calculated using the volume-weighted mean of overnight rates on trades arranged by major brokers. Data as at 19 October 2023.
6 Source: First Sentier Investors. Data as at 19 October 2023.
Important Information
This material has been prepared and issued by First Sentier Investors (Australia) IM Ltd (ABN 89 114 194 311, AFSL 289017) (FSI AIM), which forms part of First Sentier Investors, a global asset management business. First Sentier Investors is ultimately owned by Mitsubishi UFJ Financial Group, Inc (MUFG), a global financial group. A copy of the Financial Services Guide for FSI AIM is available from First Sentier Investors on its website.
This material is directed at persons who are ‘wholesale clients’ (as defined under the Corporations Act 2001 (Cth) (Corporations Act)) and has not been prepared for and is not intended for persons who are ‘retail clients’ (as defined under the Corporations Act). This material contains general information only. It is not intended to provide you with financial product advice and does not take into account your objectives, financial situation or needs. Before making an investment decision you should consider, with a financial advisor, whether this information is appropriate in light of your investment needs, objectives and financial situation.
The product disclosure statement (PDS) or Information Memorandum (IM) (as applicable) for the Wholesale Australian Bond Fund ARSN 087 570 885 (Fund), issued by Colonial First State Investments Limited (ABN 98 002 348 352, AFSL 232468) (CFSIL) should be considered before deciding whether to acquire or hold units in the Fund(s). The PDS or IM are available from First Sentier Investors. The target market determination (TMD) for the Fund is available from First Sentier Investors on its website and should be considered by prospective investors before any investment decision to ensure that investors form part of the target market.
MUFG, FSI AIM, their respective affiliates and any service provider to the Fund do not guarantee the performance of the Fund or the repayment of capital by the Fund. Investments in the Fund are not deposits or other liabilities of MUFG, FSI AIM, their respective affiliates or any service providers to the Fund and investment-type products are subject to investment risk including loss of income and capital invested.
Any opinions expressed in this material are the opinions of the individual author at the time of publication only and are subject to change without notice. Such opinions: (i) are not a recommendation to hold, purchase or sell a particular financial product; (ii) may not include all of the information needed to make an investment decision in relation to such a financial product; and (iii) may substantially differ from other individual authors within First Sentier Investors.
To the extent permitted by law, no liability is accepted by MUFG, FSI AIM nor their affiliates for any loss or damage as a result of any reliance on this material. This material contains, or is based upon, information that FSI AIM believes to be accurate and reliable, however neither MUFG, FSI AIM nor their respective affiliates offer any warranty that it contains no factual errors. No part of this material may be reproduced or transmitted in any form or by any means without the prior written consent of FSI AIM.
Any performance information has been calculated using exit prices after taking into account all ongoing fees and assuming reinvestment of distributions. No allowance has been made for taxation. Past performance is not indicative of future performance.
Copyright © First Sentier Investors
All rights reserved.
 |  |
|---|